
Word count: 3,238 Reading Level: College Grad Reading time: 11.46 Mins
A successful content marketing strategy can always be traced back to a quality website content audit. A website content audit is vital for any business as the process paints a clear picture on how useful the content is, both from the customer’s and the organisation’s perspective. Literally, a content audit helps you to rate your websites content based on the following criteria:
- Is your website content up to the date?
- Is the content promotional?
- Does the content tally with the business voice?
- Is the content optimised for search engines?
- Is the content optimised for keyword density?
- Is the content logically placed? and much more
A content audit is something that can be achieved by following a conglomerate of strategies. Each organisation should follow a content strategy that blends in perfectly with respect to their niche, target audience, website structure and so on. However, there are several imperative universal factors or strategies that you need to pool-in while performing a content audit for your business website. Compiled here are some of these content strategies that will assist you to perform a perfect website content audit.
Preparing a content inventory
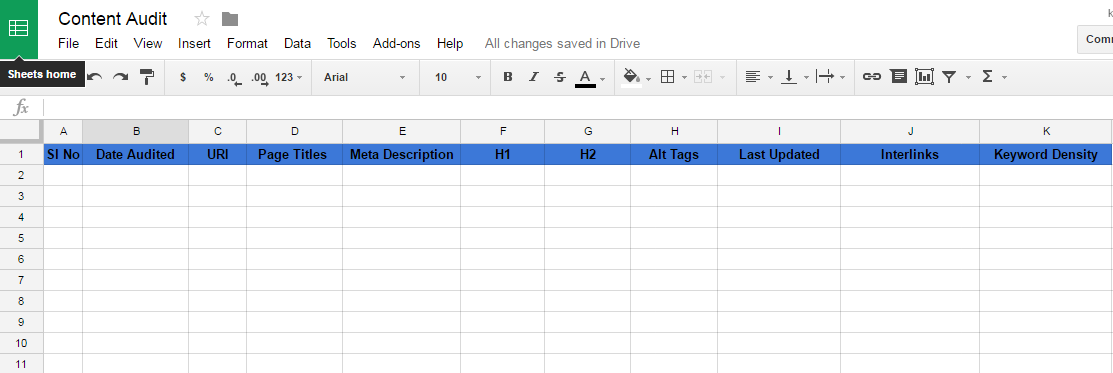
A content inventory helps you map the content on your website with respect to metrics like date updated, URL, title etc. You can create a content audit inventory using a spreadsheet document via Google drive or MS Excel.
For an open source reference we will use Google docs.
Instructions Go to Google drive Click on New-> Google Sheets.
Once you have created a content audit spreadsheet, you can assign the following dimensions as the columns. URI, Page Titles, Meta Description, H1, H2, Alt Tags, Last Updated, Interlinks, Keyword Density and Date Audited.
We recommend a Google drive spreadsheet for content audits due to the following reasons:
- With Google Sheets, you can track your work and time of last update
- Assign or share the work with your colleagues or team members
- Easy to access platform with no concerns on data loss
Once you have assigned titles for you content audit spreadsheet, it’s time to pull in the pertinent statistics.
We can start by procuring a list of website URL’s. There are several means too extracting all the URLs in websites, listed here are a few:
Manually: You can manually visit all the website pages and copy paste the ULRs to the spreadsheet, however, the task becomes cumbersome if your site has myriads of pages.
Google Analytics: Login to the Google Analytics property connected to your website, Navigate to Behavior-> Site Content -> All pages
The analytics will provide you a list of URLs, sorted in the most visited order, click on the popup placed towards the end of each of the URLs to open the URL in a separate browser window. Copy paste the URL into the spreadsheet. Here again, website with thousands of pages makes it a time-consuming task (ergo the cost of outsourcing this task to an agency).
Screaming Frog: Screaming Frog is an excellent search engine spider simulator that helps you with complete content audit of your website, one among the many features that it offers is a list of complete website URLs. Install Screaming Frog and initiate a website scan to procure a list of the entire website URLs in minutes. Screaming Frog is the ideal tool to handle ecommerce type websites with thousands of pages.
Once you get your hands on the list of website URLs, you can use Screaming Frog to get the following dimensions against each URL:
- Page Titles
- Meta Descriptions
- H1 & H2
- Alt Tags
You can calculate the rest of the statistics as follows:
Last updated: You can login to your website admin dashboard to get the information on when each page was last updated. For instance, when you are using a WordPress content management system, you can get the value last updated value from the “revisions” link place adjacent to the publish button with each page.
Interlinks: You can manually visit all the pages, to list down internal links on each page. Keyword Density: Keyword density is calculated as the number of times the target keyword is used by the total number of words on the page multiplied by 100.
Keyword Density= Number of time Target Keyword is used/Total content word count * 100
Ideal keyword density is 1 to 3% and a right conglomerate of LSI and Semantic keywords can help the page perform better on SERPs.
Content Audit Rules
Now, you have an ideally crafted content inventory; let’s look at how to weigh each of the values in the respective inventory against the SEO etiquette.
Page Title & URL:
- Limit characters to 65
- Incorporate keywords
- Avoid usage of numbers and underscores
Meta Descriptions:
- Limit the character count to 160
- Write meta descriptions with call-to-action element meant for humans, not search engines
- Try to include both primary and secondary keywords wherever applicable
H1 & H2:
- Use keywords or sentences relevant to the page title
- Usually, variant of or the exact most important keyword on the page is used as H1
- Variant or the second most important keyword on the page is used as H2
Alt Tags: * Name your images descriptively * Optimize all the images with descriptive alt tags * Do not over-optimize alt tags by stuffing keywords * For images of products with serial numbers, include specific number in alt tags
Interlinks:
- Try to incorporate at least two interlinks on each page
- Do not link back to Home or About us page, unless it is absolutely necessity
- Avoid using “here”, “view” etc as anchor text wherever possible
Keyword Density:
- Stick with a KW value of 1 – 3%
- It is ideal to have at least 300 words per page
Now, you are aware about how to perform content audit via Google Sheets and pertinent content audit rules. Now, let us dig deep into the different ways to perform content audit via Google Analytics.
Google Analytics is an excellent free analytics tool that will help you to audit the nook and cranny of your website. Google Analytics tool offer different reports, a conglomerate of which can be used to create detailed content audit reports. We will be using the following Google Analytics Reports to perform a complete content audit for websites.
- Channels report
- New vs Returning Visitor report
- Behavior Flow report
- Frequency & Recency report
- Landing Page report
- Site Search report
The channels report
Navigate: Acquisition-> All Traffic -> Channels
The channels report provides you detailed insight to the following:
- The channels characterized by default as Referral, Organic Search, Direct and Social that are delivering traffic to your website
- A detailed report of the websites that direct visitors to your website
- The keywords using which people are finding your website from search engines
- The social channels that are bringing in quality traffic to your website
The channels detailed report is characterized as the following: Acquisition, Behavior, Conversions
While the Acquisition offers a peek at “quantity”, the Behavior and Conversions gets you an insight on Goal Conversions Rate and Quality respectively.
The channels report gives you insight on how effective your content marketing campaign has been over the channels specified above. For instance, if you are really active and consistent with your social media marketing campaign, but the “Social” in the channels report portray disappointing dimensions like a high Bounce Rate and lower Average Session Duration, you should look into the either one or all of these concerns:
- You are not delivering to the target audience
- Users are finding it hard to procure information from your landing page or landing page content is illogically placed
- The social media snippets are enticing or probing but the resultant content is not up to the mark
The channels report can also be used to track statistics from other channels like emails. The Email Behavior statistics from the Channels report can get you a clear picture on how well your emails are performing and whether you need to consider the following:
• Whether you need to perform A/B testing with different email templates • Whether you need to revamp the CTA elements on the emails subject line
The channels report also gives you an idea about whether your website is performing as expected on mobile devices. For analyzing this data, you need to click on the “Secondary Dimension” on the channels report and choose “Mobile”
Secondary Dimension Dropdown-> Choose “Mobile” from the dropdown or just type “Mobile” on the given search space.
Make use of different charts: Data, Percentage, Performance, Comparison, Term Cloud and Pivot to get a clear picture of your channels report.
New Vs Returning Visitors Report
Navigation: Audience->Behavior->New Vs Returning
New Vs Returning report is a godsend when it comes to identifying the engagement rates with your content marketing efforts. Additionally, you can get a peek at the how successful the content has been in creating brand awareness and assisting existing audience to achieve specific goals.
The New Vs Returning report is ideal to understand the type of content that can be pushed to bolster fan base (in terms of social followers, newsletter signups etc). Therefore, this report can come in handy in sorting out the type of content marketing strategy to stick with.
Unlike most of the other reports, the New Vs Returning report doesn’t really stress on goal conversions and leads, however, the report is really useful when it comes to understanding how effective your content marketing strategy has been when it comes to influencing existing or new customers via multiple channels.
Your content marketing goals determines how you should look upon the New Vs Returning report. Two of the common scenarios are given below:
New Visitors: When your content marketing goal revolves around introduction of your brand among potential customers, you need to look at the New Visitors report. Under such a scenario, you can ideally set the pertinent statistics as your Key Performance Indicator (KPI). You need to keep a close eye on this report in case of product or service launches. In both scenarios, an increase in new visitors is an indicator that your content is reaching new audience; compare the different values in the report like Avg. Session Duration, Bounce Rate and Pages/Session to improvise your content marketing campaign.
Returning Visitors: The Returning Visitor report plays a crucial role in cases where your website has a login. For instance, discussion or networking websites, where people login to discuss their perspective or contribute to the concerns or queries of other registered users- with such websites, you need to plan your content marketing campaign in such a way so as to make audience return. Concentrate your efforts on this report and set quarterly or monthly goals to increase the respective numbers. Returning visitors can always be an asset as they can turn out to be brand influencers and even lead to higher conversions. If you find a good rate of returning visitors, without many conversions, you need to start asking questions and check for any disparities in call to actions and content offered on website or for any other issues that affects the user experience.
Take a detailed peek at the New Vs Returning report to identify the audience category that has been helping your business to achieve targets.
Behavior Flow Report
Behavior Flow report is a good indicator of how the visitors are navigating through your website.
Navigation: Behavior -> Behavior Flow
Great content marketing campaigns can help you to drive target audience to your website, but so often, it’s difficult to get a clear picture of what people do after reading your content. This is where Behavior Flow report can come in handy; the report maps the different paths via which website visitors’ traverse after landing on any page on the website. This report can help you to identify drop offs (where people exit from your site), which can turn out to be crucial in structuring your website with respect to your content marketing goals.
For instance, if you are experimenting with two landing pages, you can use this report to understand which landing page is more effective in compelling the people to continue navigating your website. Similarly, if you find a web page which has a high drop off percentage and which is between the contact form and one of the landing pages on your website, you can reconfigure this particular page to increase the conversion rate.
Frequency & Recency Report
Website traffic patterns portrayed through the frequency and recency report provides a clear picture on the number of times users have revisited your site within a chosen time frame.
Navigation: Audience-> Behavior-> Frequency & Recency
The frequency & recency metric are measured by sessions from unique visitors, which, is sorted out by analyzing respective cookies. Hence, in cases where the user deletes cookies, the entire report is reset for him/her.
Frequency & Recency report gives information about the frequency with which users revisits your websites in terms of the average number of times the visitor visits your website and the average amount of days between these sessions.
Opening the Frequency & Recency report gets you metrics like Count of Sessions, Sessions and Pageviews.
The Count of Sessions value that you see on the initial report comprises of both New and Returning Visitors to the site, therefore, if you want to get your hands on any of the individual metrics, you need to use advanced segments.
Add advanced segments and filter your report as follows:
- Click on “Add Segment”
- Then “New Segment”
- Add “Segment Name” for instance, “Returning visitors to the service page”
- Click on “Conditions”
- Set conditions
- Click on “Filters”
- Set filters to get the required value. Count of Session is an actual indicator the average number of sessions that returning visitors has on your website. When it comes to lead conversion, you have to perform a thorough check on the values and try to reduce the number of sessions.
Day since Last Session Report: This report is an indicator of the frequency of days between which the visitors are returning to your site. This report can be used to understand how often you need to push content to keep the audience engaged.
Landing Page Report
Deciding on what to cater to audience is one of the cumbersome tasks that any digital or online marketers face. But what if you have a means to get an insight on the pages or content types on your website that has been keeping the audience engaged, by getting you access to details like Average Session Duration, Bounce Rate, Conversions and Sessions. This is just what Google Analytics Landing Pages Report offers you.
Navigation: Behavior-> Site Content->Landing Pages
Landing page reports are excellent means to get deeper insights on effectiveness of your contact form/page especially when you are conducting an A/B testing campaign.
The Landing Pages Report gets you the list of current pages on your website that are preferred by the users based on sessions.
Similar to the Channels Report, the Landing Pages Report is categorized into three Acquisition, Behavior and Conversions. The Acquisition session gives you insight on the number of sessions for the chosen time period, in addition to providing values for new sessions and users.
The Behavior section is the most important one in this report as it gives you a glance at the landing page bounce rate and average session duration. You can plan your content marketing campaign based on these report to try and decrease the bounce rate and increase the average session duration.
The conversion section gets you a glance at the content type that is bringing more conversions. Usually, people use these conversions section to get details about newsletter subscriptions (usually in cases where the landing page is a blog post) or contact form submissions (in cases where landing page is a blog post or any of the website main pages).
Now, if you wish to learn more about the source that is getting the audience to land on these pages to start with, you could click on the website URL that you would like to get the pertinent information and use the “Secondary Dimension” option to choose “Source/Medium” or just type “Source” on the given search space.
With these efforts, you have information about the type of content on your website that your audience find valuable and the channels or source that are bringing in visitors to these pages. The conglomerate of this information can be used to plan and set goals for your content marketing campaign.
For instance, you can get values of sessions and conversion rate over a quarter of year and try to better the value in the next quarter by following a consistent and guided content marketing campaign. It is always ideal to rely over “sessions” rather than the “page view” because a session kicks off with the user landing on any page of your website, while page view counts with the users visiting the same page again during a single session.
Site Search Report
Site Search Report is an excellent report that provides a clear picture of what people are searching for, on your site. Usually, people who visit a website, uses the search bar when it is difficult to find what they are looking for. Therefore, the report helps you identify the user experience issues on the site.
Navigation: Behavior->Site Search-> Search Terms
Procure the site search report for a month or a couple of months to get a detailed insight on the keywords that people are using to perform a search on your website, sort out the most frequently used keywords or variants of the same keywords to understand what your site content or architecture is lacking. For instance, if you have a long list of blog posts on your website and visitors are using the search bar on the blog home page to find a post which is buried deep in the blog archive, you could consider placing that blog on the home page under the category “Hot Topics”.
Content audit is imperative for structuring a perfect content marketing strategy. Experiment with your content and use these strategies to understand how well the content has been performing and how you can improvise to garner engagement and conversion rates.
Bibliography:
Mozcom. (2016, no-date). How to Use Six Google Analytics Reports to Complete a Website Content Audit. [Weblog]. Retrieved 10 September 2016, from https://moz.com/ugc/how-to-use-six-google-analytics-reports-to-complete-a-website-content-audit
Mozcom. (2016, no-date). How To Do a Content Audit – Step-by-Step. [Weblog]. Retrieved 10 September 2016, from https://moz.com/blog/content-audit-tutorial
Quicksproutcom. (2016, no-date). How to Conduct a Content Audit on Your Site. [Weblog]. Retrieved 10 September 2016, from https://www.quicksprout.com/2014/04/24/how-to-conduct-a-content-audit-on-your-site/
Marketinglandcom. (2015, 16 February 2015). How To Conduct A Content Audit. [Weblog]. Retrieved 10 September 2016, from http://marketingland.com/conduct-content-audit-117781
Shoutmeloudcom. (2012, 21 June 2012). What’s The Optimum Keyword Density for Better Ranking?. [Weblog]. Retrieved 10 September 2016, from http://www.shoutmeloud.com/keyword-density-seo.html
Searchenginewatchcom. (2016, no-date). How to Use the Google Analytics New vs Returning Report. [Weblog]. Retrieved 10 September 2016, from https://searchenginewatch.com/sew/how-to/2280159/how-to-use-the-google-analytics-new-vs-returning-report
Studybreakmediacom. (2014, 5 March 2014). Understanding the Google Analytics Frequency Metric – studybreakmedia. [Weblog]. Retrieved 10 September 2016, from http://www.studybreakmedia.com/understanding-google-analytics-frequency-metric/